
Stop Using "Watermelon" Dashboards
Aug 27, 2026
You know that strange confusion in your head right before you project a perfectly green status slide onto the boardroom screen, knowing full well the project is secretly falling apart? As a leader driving a complex transformation, you know the ritual of the monthly executive update.
You spend hours aggregating data, coloring cells, and building beautiful, reassuring progress reports. You walk into the boardroom, present a sea of green indicators, and everyone smiles. On the surface, the leadership team feels reassured.
But deep down, you know the truth: the project is secretly struggling. Delivery is slowing. Decisions are stuck. Risks are building underneath the surface. And yet, the report still looks perfectly green.
This is the dangerous illusion of the Watermelon Dashboard.
A Watermelon Dashboard, a term highlighted in Forbes and ProjectManagement.com publications, perfectly describes a project that looks bright green on the outside to executives, but is bleeding red on the inside where the real work is happening.
This is not just a reporting problem; it is a profound leadership problem. When risk is filtered or softened as it moves up the hierarchy, executives lose access to the truth at exactly the moment they need it most. Forbes publications note that up to 100 percent of critical risk data is deliberately filtered or diluted as it moves up the hierarchical chain. When 80 percent of project pods report a sanitized "green" status to directors, the truth is lost, and velocity inevitably grinds to a halt.
The cost of that illusion is severe. According to Bain & Company Business Transformation Data, 88 percent of business transformations fail despite receiving positive mid-cycle reporting.
However, recent data from the Project Management Institute (PMI) Pulse of the Profession reveals the antidote: projects that define exact success criteria up front and establish strict performance measurement systems achieve success rates nearly twice as high as those that do not.
The Multi-Million Dollar Illusion of "Green" Status
Let me walk you through the hidden reality of how sanitizing the truth to protect executive comfort actually destroys a business from the inside out. To understand the catastrophic impact of the watermelon trap, we must examine the high-profile failure at Revlon.
Revlon initiated a massive SAP S/4HANA implementation to modernize its global manufacturing and retail supply chain operations. The executive steering committee, however, fell completely victim to the watermelon status report. Because leadership was detached from tactical realities, they relied entirely on reassuring, sanitized "green" updates from their external systems integrators.
They were blinded to reality and ignored critical warning signals occurring deep within the project structure. These red flags included the sudden replacement of the lead project architect and a dramatic spike in functional change requests. To protect an arbitrary calendar date, the team drastically shortened critical testing phases while still reporting a positive outward status.
The report said, “green.” The project reality said, “red.”
Upon launch, the lack of operational alignment led to a complete rupture in the supply chain. Revlon lost visibility into its global inventory and could not process basic vendor payments. According to The Wall Street Journal and SEC Filings surrounding the Revlon Investor Class-Action Lawsuit, this reporting failure resulted in $64 million in lost retail sales in a single quarter and an immediate 6.9 percent plunge in stock valuation.
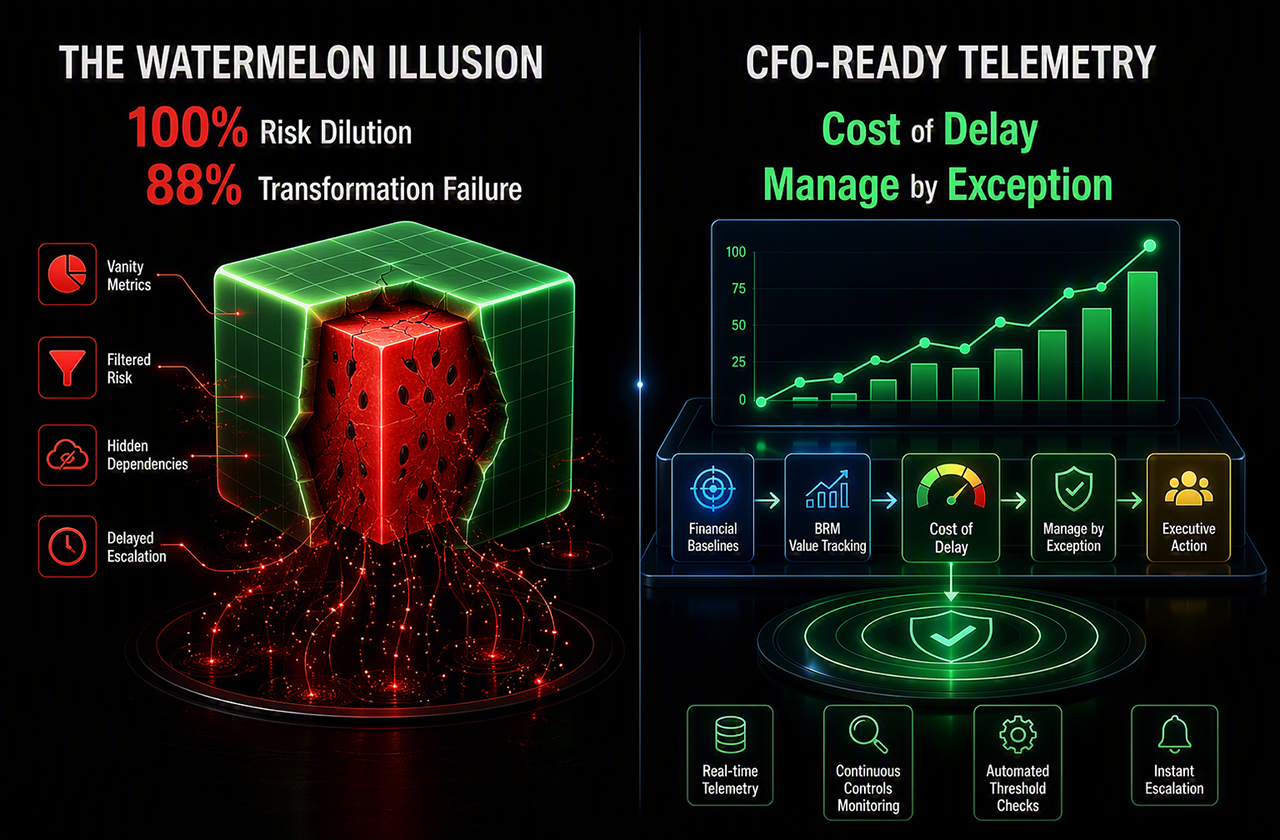
Fig1. The Watermelon Illusion vs. CFO-Ready Telemetry. An operational matrix contrasting the 88% transformation failure rate caused by diluted, sanitized reporting against the objective, financially aligned governance of Cost of Delay and Manage by Exception protocols.
The Danger of Tracing for the Sake of Tracing
Reporting to project steering committees or boards is not easy. I remember at the beginning of my career how anxious I was about what to present.
I wanted to make sure we were showing the right progress to leadership and keeping them engaged so we could get the support we needed. I would spend hours thinking about each stakeholder in the meeting, trying to figure out what they liked to know, how they wanted to see it, and what the most important metric was for them.
What I have learned over the years is that trying to please everyone with fifty different charts leads to massive cognitive overload.
Although there are standards, each board member may be focused on a specific area. The best approach is to agree from day one on exactly which metrics will be used and presented. Ask for and get absolute agreement from all members on what success looks like, and show them how you will track it simply.
Do not overcomplicate or overengineer your executive reporting. The most important thing is to stop tracing metrics just for the sake of tracing them. You must focus entirely on the actual added value in the end, stripping away vanity metrics that hide project friction.
Why AI Charts Cannot Generate Executive Empathy
This brings us to the common illusion in executive reporting today. You might think Artificial Intelligence is the magic bullet to fix biased dashboards, but here is the twist: Generative AI isn't revealing the truth; it is simply automating your sanitized lies.
Frustrated by weak reporting and poor visibility, Project Management Offices are desperately turning to new technologies to save their dashboards.
The Trend: Organizations are rapidly integrating generative AI plugins to scan datasets and instantly generate complex, colorful status dashboards. They want these reports to be completely untouched by human hands, hoping to eliminate reporting bias and save administrative time.
The Illusion vs. Reality: Generative AI is highly proficient at detecting mathematical patterns and formatting massive amounts of raw data. But it completely lacks the human context required to explain exactly why a critical metric has shifted.
If human managers manipulate or filter the underlying data out of fear before it reaches the system, AI will not fix the truth. It will simply digitize chaos. Predictive AI will make the wrong decisions faster, creating polished, beautiful distortions. Generating 50 complex, AI-driven charts without a cohesive narrative directly leads to cognitive overload for the C-suite and amplifies the "Watermelon Project" phenomenon. AI can format a flawless chart, but it cannot generate executive courage or empathy.
The Tangible Future: The tangible future of enterprise reporting relies on Agentic AI, bypassing human reporting filters entirely. Agentic AI will ingest ground-truth telemetry directly from digital nodes to establish truly objective health gates. It will automatically translate technical delays into financial "cost-of-delay" metrics to compel immediate C-suite engagement by establishing undeniable fiduciary liability.
The Playbook for Truthful Executive Reporting
To accelerate your career and earn the ultimate respect of the C-suite, you must dismantle the Watermelon Dashboard. Your dashboard should not be designed to comfort the room; it must reveal the truth early enough for leadership to act.
Here is your concrete, battle-tested framework for reporting the truth and protecting your enterprise.
Step 1: Define Financial Success Criteria Upfront
The foundation of honest reporting begins long before the first status meeting is ever scheduled. You must sit down with your sponsor and formally secure executive sign-off on the exact financial and strategic baselines. You must figure out what the C-suite actually cares about, rather than just tracking purely technical milestones. Executives do not care how many lines of code were written; they care about market share, cost reduction, and revenue generation. If you do not define these financial success criteria upfront, you will inevitably fall back on reporting meaningless vanity metrics.
Step 2: Shift from EVM to Benefits Realization Management
Traditional project management relies heavily on Earned Value Management (EVM). Earned Value Management is a standard project-control method that measures how quickly a project is burning through its budget and schedule relative to the original plan. While EVM is great for tracking raw activity, you can have a perfect EVM score while building a system the company hates. To command executive attention, you must transition to Benefits Realization Management (BRM). Benefits Realization Management is the professional project practice of continuously tracking whether the technical work is actually generating the projected financial or operational benefit promised in the business case. By using BRM, you stop reporting on whether the project is "on time" and start reporting on whether it is "valuable."
Step 3: Build a "CFO-Ready" Dashboard (Cost of Delay)
To truly capture executive attention, you must speak the language of the boardroom: money and risk. Translate every technical blocker into a Cost of Delay metric on your dashboard. Cost of Delay is a financial metric that calculates the exact dollar amount lost for each week a requested feature is delayed. When you tell a CFO that a server integration is delayed, they may nod and move on. When you tell a CFO that the server delay represents a $50,000 weekly Cost of Delay, they will immediately remove the roadblock. Presenting hard financial data transforms you into a strategic protector of enterprise value.
Step 4: Institute "Manage by Exception" Escalation
The final step in curing the watermelon effect is to completely change how and when you escalate bad news. You must establish independent oversight using Manage by Exception. Manage by Exception is a governance structure where the project runs autonomously within strictly agreed-upon tolerances for budget, schedule, and quality. As long as the project is within those tolerances, leadership does not need to intervene. However, the exact moment a threshold is breached, autonomy ends, and escalation becomes mandatory. You must bring your CFO-Ready data to the sponsor the day the breach occurs, rather than waiting for a comfortable monthly status meeting.
Good managers do not earn respect by making troubled projects look green. They earn respect by making the truth visible early enough for leaders to act.
If you are ready to stop hiding behind vanity metrics and start driving transparent, value-based delivery, take the next step. Download The Value-Delivery Scorecard using the link below to immediately transition your dashboards from tactical noise to CFO-ready intelligence.
References
- Bain & Company / Business Transformation Data. (Source for the 88% business transformation failure rate despite positive mid-cycle reporting).
- Project Management Institute (PMI) / Pulse of the Profession. (Source for the statistic that projects defining success criteria upfront achieve success rates nearly two times higher).
- Forbes / ProjectManagement.com Publications. (Source for the "Watermelon Dashboard" and "Watermelon Effect" terminology, and the statistic regarding 100% of critical risk data being diluted up the chain).
- The Wall Street Journal / SEC Filings (Revlon Investor Class-Action Lawsuit). (Source for the Revlon SAP S/4HANA failure, the $64 million in lost retail sales, and the 6.9% plunge in stock valuation).